One of the things I’ve been paying more attention to this year for my AP students has been their multiple choice performance on our in-class drills, quizzes, tests, and final exams. I’m collecting this data as a way to trace each student’s improvement over the year and see if I can spot any patterns in their performance and offer suggestions for improvement.
To track this, I set up a Google Spreadsheet for each class period (I have two this year) and then within each spreadsheet created a separate sheet for each assessments, noting the type of assessment, date, and results. The upside of this arrangement is that I can include a lot of data within each spreadsheet, tracking not only multiple choice result, but also performance on the written sections, and any extra credit earned. I could also have extra columns to re-weight the sections of an assignment if need be. The other perk was that this arrangement interfaced nicely with Socrative and Google Forms assessments, allowing me to easily port that data into a new sheet for each new assessment.
As I’ve gotten deeper into the year, however, I realize that tracing change over time for individual students is a bit of a nuisance. I chatted with a student the other day about her performance on essay writing, and while I was able to hunt down that info by clicking from sheet to sheet, it was a cumbersome process that didn’t give me a quick sense of her performance over the course of the year.
I also realized that I’ve entered data is a somewhat haphazard way, not always putting students names in the same order or in the same cells, and sometime entering students as “FirstName LastName” and other times entering students as “LastName, FirstName.” All of which goes to highlight the fact that I greatly enjoy digital humanities work, but I’m stronger on the “humanities” side of all this stuff than I am at the “digital” in some cases. Sigh.
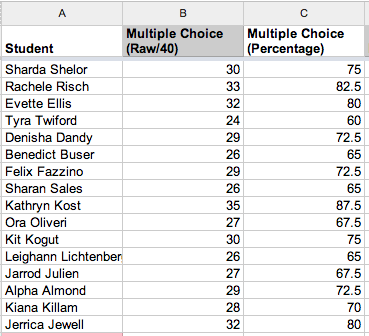
Here’s a sense of what things look like (with both delightfully alliterative randomized names and randomized data):

An example of my structure for tracking student performance on a Google Spreadsheet – with random names and data. The struggle for winner of the “fun name of the class” award in this section is a two-way race between “Denisha Dandy” and “Alpha Almond.”
So, I’m now realizing that it would be incredibly helpful to have a single sheet that traced each student’s performance on all these assessments over the course of the year. It would be super ideal is that sheet could then get auto-populated with new data each time I created a new sheet and entered new data about student performance.
I’m sure there’s a way to set this up, but I don’t know if there’s a pre-programmed script that will let me port data associated with each student into a new spreadsheet, or if there are a set of formulae that I need to enter in a new sheet to have this material carry over.
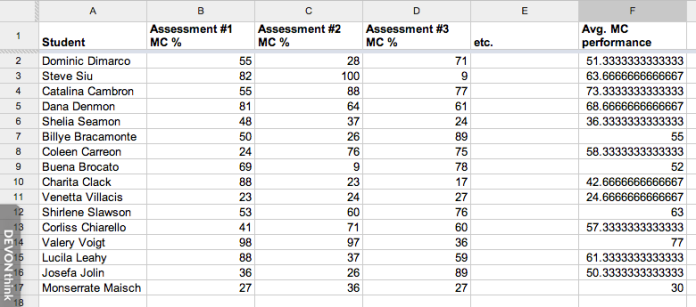
Potentially (though there are likely much better ways to set this up; I’m very open to suggestions) that type of page might look like this:

Potential arrangement of synoptic performance sheet. The undoubted winner of best name in this class is “Buena Brocato.”
In my semi-useful natural language searching around the web I found a few Google forum discussions that seemed useful, but in attempted to enter the formulae, I didn’t have much success. Are any of these actually useful?
- Auto populate from master spreadsheet to other spreadsheets
- Spreadsheet – Automatically copy and paste from one sheet to another based on content
- Moving Row of Data To New Sheet Based on Choice within that Row?
So, if anyone has suggestions about how I might go about accomplishing this, or if there is a great plug-in script to help me port this data from a bunch of separate sheets to one single sheet, I’d greatly appreciate the insight!
I faced a similar dilemma a few years back and thankfully some friends of mine who were in business school at the time helped me out. The magic formula you’ll use is VLOOKUP. If you want to share me on the document I can show you.
The one caveat, you’ll need to get consistency in how you identify your students, as the function looks for the same indicator every time. I’m not 100% sure if it will work with text, as I’ve always used student ID.
Y’know, so long as the student names stay in the same order and the info that you want from the various worksheets stays in the same columns… you should be able to do this with arrayformula(), indirect() and concatenate(). You’d want to have predictable worksheet names (ideally things that are counted — Day 23 or 2014-02-03…) so that it would be easier to calculate column names.
Assume you have a formula that calculates column names (which match worksheet names) across the top. (And you can fiddle with this if you want two or three columns from every worksheet — like in my Google Docs Syllabi: http://battis.net/blog/2009/11/22/google-docs-syllabi/ which does this by rows, rather than columns.) Then you can fill in each column under that label with a formula like this (assume that b1 is the column label and this formula is in b2):
=arrayformula(indirect(concatenate(b1,”!c2:c”)))
This will pull all of the data from column c of the worksheet with the same name as b1, except for the first row (presumably the column label).
You could even trick out your master sheet so that it doesn’t show a new column name until the appropriate date has arrived… so that the summary column just travels along the right-side of your data.
Obviously, there are some wrinkles and finesse moves in here, but that’s the basic idea.
You create a spreadsheet. It has two original sheets: a “cumulative” and an “assignment template”. Both have same names listed in the same order, etc.
Every new assignment is entered on a copy of the assignment template (use duplicate option). Once entered, you select all scores, copy them, go to cumulative sheet, add a column between most recent entry and running average (rightmost column), and paste in scores.
Problem solved.
Bonus: use conditional formatting to color code cells that have specific scoring cutoffs to make trends more easily viewable.